
Key takeaways
Australia’s property markets are navigating a critical juncture as we head deeper into 2025, with mixed signals emerging from the broader economy.
On the one hand, inflation is coming under control, and the RBA is tipped to cut interest rates this week.
On the other hand, our economy is strong, with significant job creation and unemployment remaining at virtually historic lows.
However, global economic uncertainties and ongoing local challenges are keeping business and consumer confidence patchy.
Yet despite this economic ambiguity, the resilience of our housing markets remains striking.
This week, CoreLogic Research reports that:
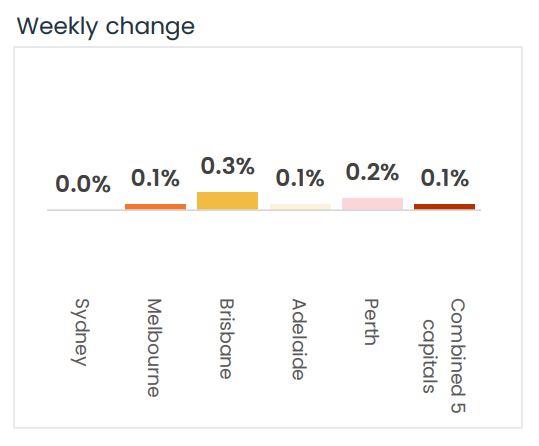
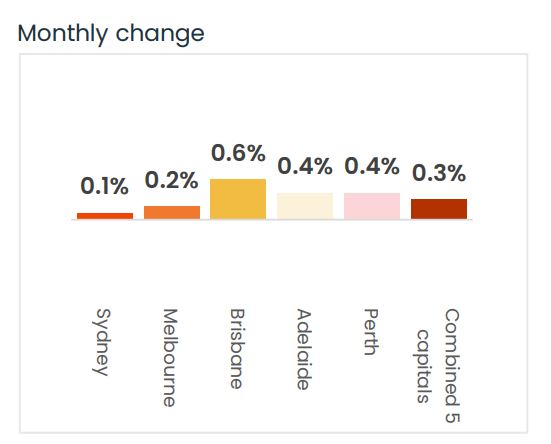
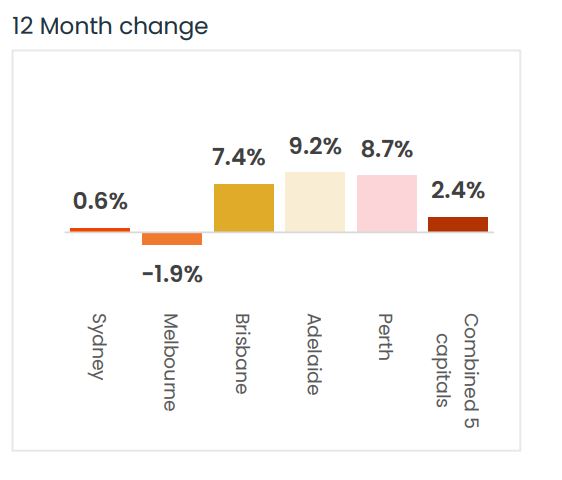
*Sydney property prices remained flat over the last week, increased 0.1% over the last month and are 0.6% higher than they were 12 months ago.
*Melbourne property prices increased 0.1% over the last week, increased 0.2% over the last month, and are -1.9% lower compared to 12 months ago.
*Brisbane property prices increased 0.3% over the last week, increased 0.6% over the last month and are 7.4% higher than they were 12 months ago.
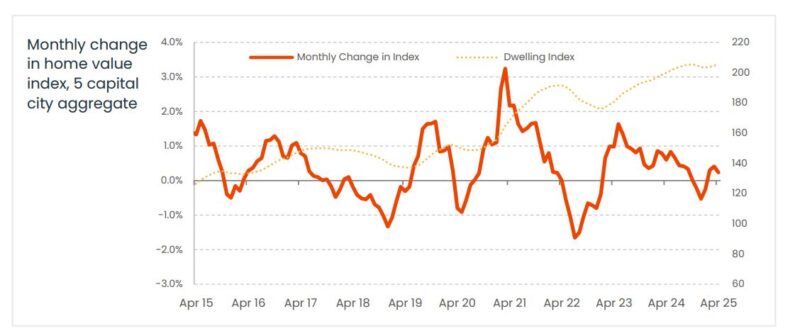
Overall, Australian capital dwelling prices increased 0.3% over the last month and are now 2.4% higher than they were 12 months ago.
There were 1,835 auctions were held across the combined capitals last week.
The preliminary auction clearance rate is at 68.8%.
This current property cycle has been driven by an undersupply of good properties relative to current demand pushing up property values and rents there was nothing to suggest there will be any significant change in the near future.
Unfortunately, the undersupply properties is going to persist for some time with all commentators agreeing that there is no way we're going to hit the housing construction targets required to meet our demand.
Australia’s property markets are navigating a critical juncture as we head deeper into 2025, with mixed signals emerging from the broader economy.
On the one hand, inflation is coming under control, and the RBA is tipped to cut interest rates this week.
On the other hand, our economy is strong, with significant job creation and unemployment remaining at virtually historic lows.
However, global economic uncertainties and ongoing local challenges are keeping business and consumer confidence patchy.
Yet despite this economic ambiguity, the resilience of our housing markets remains striking.
Property prices are continuing to edge higher in most capital cities, driven by chronic undersupply, record high migration, and the expectation of a number of rate cuts throughout this year.
The depth of buyer demand has been confirmed by the strong auction clearance results over the weekend, especially in Melbourne.
On the auction front...there were 1,835 auctions were held across the combined capitals last week
The preliminary auction clearance rate is at 68.8%
According to CoreLogic, there's a slip in preliminary clearance rate across combined capitals.
This week, CoreLogic also reports that:
- Sydney property prices remained flat over the last week, increased 0.1% over the last month and are 0.6% higher than they were 12 months ago.
- Melbourne property prices increased 0.1% over the last week, increased 0.2% over the last month, and are -1.9% lower compared to 12 months ago.
- Brisbane property prices increased 0.3% over the last week, increased 0.6% over the last month and are 7.4% higher than they were 12 months ago.
Overall, Australian capital dwelling prices increased 0.3% over the last month and are now 2.4% higher than they were 12 months ago.
Clearly, the property cycle is moving on but our markets are very fragmented.
Source: CoreLogic May 19th 2025
Of course, these are "overall" figures - there is not one Sydney or Melbourne or Brisbane property market.
And various segments of each market are performing differently.
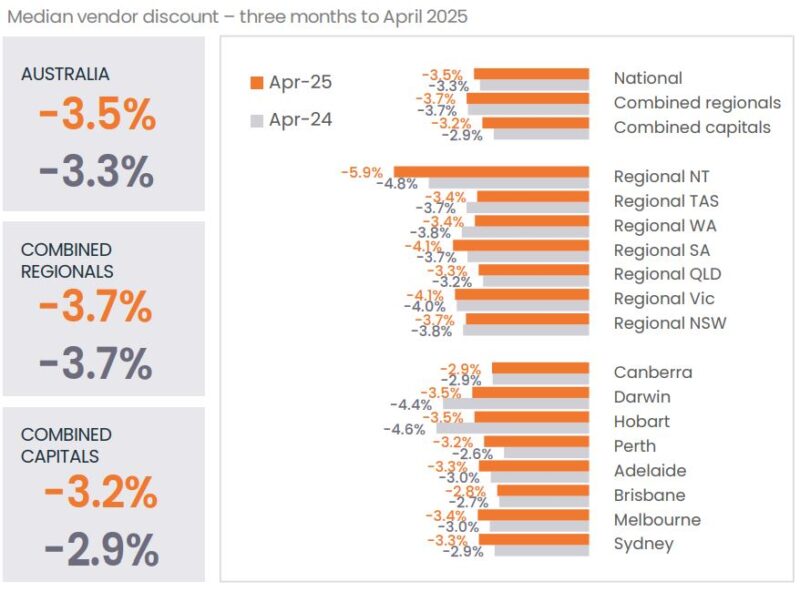
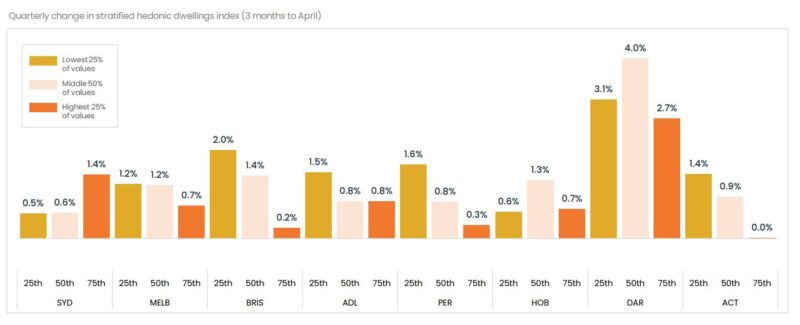
At the beginning of this cycle the upper quartile of the market lead the upswing but last year the lower quartile across every capital city recorded a stronger outcome for housing values relative to its upper quartile counterpart.
The following chart shows how various segments of each capital city market are performing differently with median-priced properties performing well.
To help keep you up-to-date with all that's happening in property, here is my updated weekly analysis of data and charts as of 19th May 2025 provided by SQM Research, CoreLogic, and realestate.com.au.
Current property asking prices
Property asking prices are a useful leading indicator for housing markets - giving a good indication of what's ahead.
Here is the latest data available:
Sydney
| Property type | Price ($) | Weekly Change | Monthly Change % | Annual % change |
|---|---|---|---|---|
| All Houses | 2,038,727 | -3.069 | 1.3% | 5.9% |
| All Units | 854,431 | 0.564 | 1.3% | 6.8% |
| Combined | 1,557,155 | -1.591 | 1.3% | 5.8% |
Source: SQM Research
Melbourne
| Property type | Price ($) | Weekly Change | Monthly Change % | Annual % change |
|---|---|---|---|---|
| All Houses | 1,278,290 | 0.790 | 0.4% | 1.8% |
| All Units | 628,365 | 1.035 | 0.2% | 3.5% |
| Combined | 1,073,175 | 0.867 | 0.3% | 1.9% |
Source: SQM Research
Brisbane
| Property type | Price ($) | Weekly Change | Monthly Change % | Annual % change |
|---|---|---|---|---|
| All Houses | 1,232,304 | 3.266 | 1.1% | 12.5% |
| All Units | 714,923 | -0.723 | -0.7% | 17.8% |
| Combined | 1,102,374 | 2.264 | 0.8% | 13.2% |
Source: SQM Research
Perth
| Property type | Price ($) | Weekly Change | Monthly Change % | Annual % change |
|---|---|---|---|---|
| All Houses | 1,125,006 | -2.111 | 0.2% | 14.2% |
| All Units | 649,670 | 2.626 | 0.2% | 26.5% |
| Combined | 1,000,524 | -0.870 | 0.2% | 16.0% |
Source: SQM Research
Adelaide
| Property type | Price ($) | Weekly Change | Monthly Change % | Annual % change |
|---|---|---|---|---|
| All Houses | 1,010,891 | -1.367 | -0.4% | 11.6% |
| All Units | 538,904 | -5.204 | -0.1% | 16.5% |
| Combined | 926,024 | -2.057 | -0.4% | 12.1% |
Source: SQM Research
Canberra
| Property type | Price ($) | Weekly Change | Monthly Change % | Annual % change |
|---|---|---|---|---|
| All Houses | 1,151,259 | 0.741 | -0.4% | -3.8% |
| All Units | 596,082 | -0.107 | -0.6% | 0.0% |
| Combined | 944,794 | 0.425 | -0.5% | -3.5% |
Source: SQM Research
Darwin
| Property type | Price ($) | Weekly Change | Monthly Change % | Annual % change |
|---|---|---|---|---|
| All Houses | 762,205 | -2.405 | -0.3% | 14.9% |
| All Units | 406,867 | 1.633 | 1.3% | 10.4% |
| Combined | 622,637 | -0.819 | 0.1% | 13.7% |
Source: SQM Research
Hobart
| Property type | Price ($) | Weekly Change | Monthly Change % | Annual % change |
|---|---|---|---|---|
| All Houses | 842,100 | -3.919 | 0.4% | 7.2% |
| All Units | 505,537 | 0.863 | 0.5% | 3.9% |
| Combined | 790,890 | -3.191 | 0.4% | 6.0% |
Source: SQM Research
National
| Property type | Price ($) | Weekly Change | Monthly Change % | Annual % change |
|---|---|---|---|---|
| All Houses | 979,937 | -1.661 | 0.4% | 6.6% |
| All Units | 583,223 | 0.552 | 0.3% | 7.2% |
| Combined | 894,223 | -1.183 | 0.4% | 6.0% |
Source: SQM Research
Cap City Average
| Property type | Price ($) | Weekly Change | Monthly Change % | Annual % change |
|---|---|---|---|---|
| All Houses | 1,461,433 | -3.542 | 0.4% | 6.0% |
| All Units | 733,633 | -0.591 | 1.0% | 8.7% |
| Combined | 1,244,928 | -2.664 | 0.5% | 6.2% |
Source: SQM Research
The value of property asking prices as a leading indicator for housing markets is quite significant.
In fact it's more valuable than median prices which can be quite misleading.
Let's delve into why this is the case and how it impacts the real estate market.
- Early Market Sentiment Indicator: Asking prices often reflect the current sentiment of sellers in the real estate market.
If sellers are confident, they might set higher asking prices, anticipating strong demand.
Conversely, if sellers are uncertain or perceive a market downturn, they might lower their asking prices to attract buyers.
This makes asking prices a real-time indicator of market sentiment, often preceding changes in actual sales prices. - Predictive of Future Price Trends: Trends in asking prices can be predictive of where the actual property prices are headed.
For example, a consistent rise in asking prices over a period can signal an upcoming rise in transaction prices. - Impact of Economic Factors: Economic factors such as interest rates, employment rates, and broader economic health influence asking prices.
For instance, changes in the Reserve Bank of Australia's policies or shifts in the job market can quickly reflect in the asking prices, providing insights into how these factors are influencing the housing market. - Regional Variations: In a diverse market like Australia's, asking prices can also provide insights into regional disparities.
For instance, the property markets in Melbourne and Sydney might behave differently from those in Brisbane or Perth. Asking prices can give early indications of these regional trends. - Influence of Supply and Demand: Asking prices are also a response to the balance of supply and demand in the market.
In areas with limited supply and high demand, asking prices tend to be higher and vice versa.
However, it's important to note that while asking prices are a valuable indicator, they should not be used in isolation.
Other factors like actual sales prices, time on the market, auction clearance rates, and economic conditions also play crucial roles in understanding the property market dynamics.
READ MORE: The latest median property prices in Australia’s major cities
Last weekend's auction report
Slip in preliminary clearance rate across combined capitals
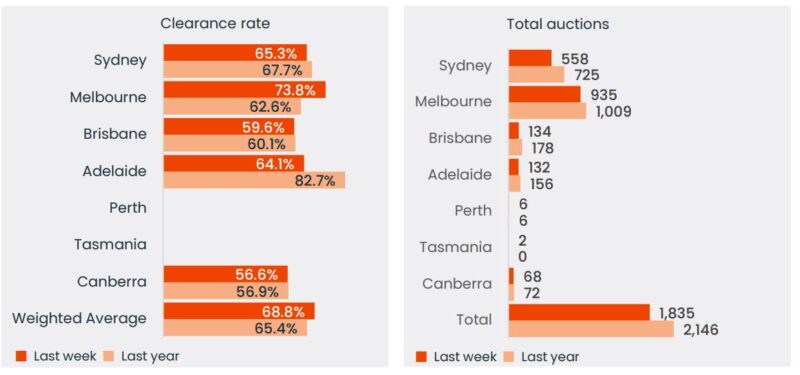
After holding above the 70% mark for the past two weeks, the combined capital city preliminary auction clearance rate slipped back to 68.8% last week.
Despite the slip, last week’s early clearance rate remains slightly above the year-to-date average of 68.0%.
1,835 auctions were held across the combined capitals last week, the highest volume since the week prior to Easter, when 3,066 homes went under the hammer.
- Also read:Everything you need to know about the state of Australia’s property markets in 20 charts – May 2025

- Also read:Latest property price forecasts for 2025 revealed. What’s ahead in our housing markets in the next year or two?
- Also read:Where should I buy my next investment property in Australia?
- Also read:This week’s Australian Property Market Update – Latest Data, State by State May 20th 2025
- Also read:Brisbane Property Market Forecast [2025] – What’s Ahead & Where to Invest


Melbourne was the only capital city to post a preliminary clearance rate above the 70% mark last week.
At 73.8%, last week’s result was the city’s second-highest early clearance rate so far this year.
935 auctions were held across Melbourne last week, up from 799 the week prior, but -7.3% below the levels recorded a year ago.
Sydney was home to 558 auctions last week, down from 656 the week prior and -23.0% fewer auctions than this time last year.
The preliminary clearance rate also slipped lower, coming in at 65.3%.
Excluding the more volatile results from January, last week was the lowest preliminary clearance rate for Sydney since the week ending December 15th, 2024 (63.0%).
Brisbane hosted the most auctions across the smaller capitals last week, with 134 homes taken under the hammer, the highest volume since the week prior to Easter (135).
After bouncing higher the previous week to 69.7% (revised down to 59.8%), Brisbane’s preliminary clearance rate weakened last week, dropping back to 59.6%.
132 homes went to auction in Adelaide last week, up from 109 the previous week.
The preliminary clearance rate reduced to 64.1%, down from 66.7% the week prior, and tracking below the year-to-date average of 67.4%.
The ACT saw 68 auctions held last week, up from 50 the week prior.
56.6% of auctions have recorded a successful result so far, the lowest preliminary clearance rate in three weeks.
Four of the six auctions held in Perth last week have been collected so far, three of which were successful, while the one auction result reported so far in Tasmania was unsuccessful.
It seems that many vendors are holding out for the RBA’s interest rate decision this week.
With the cash rate widely expected to reduce today, the volume of scheduled auctions across the combined capitals is set to rise to around 2,360 this week – a 29% jump on last week, before rising further next week, to around 2,700 auctions.
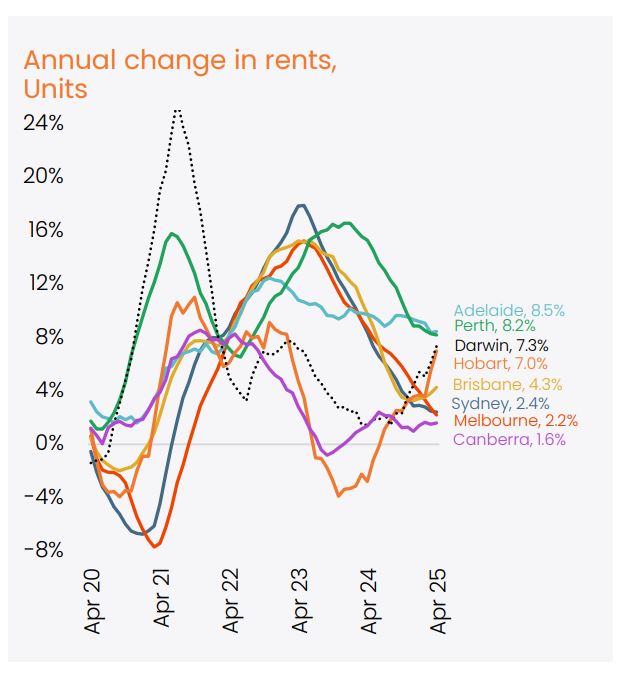
Our rental markets
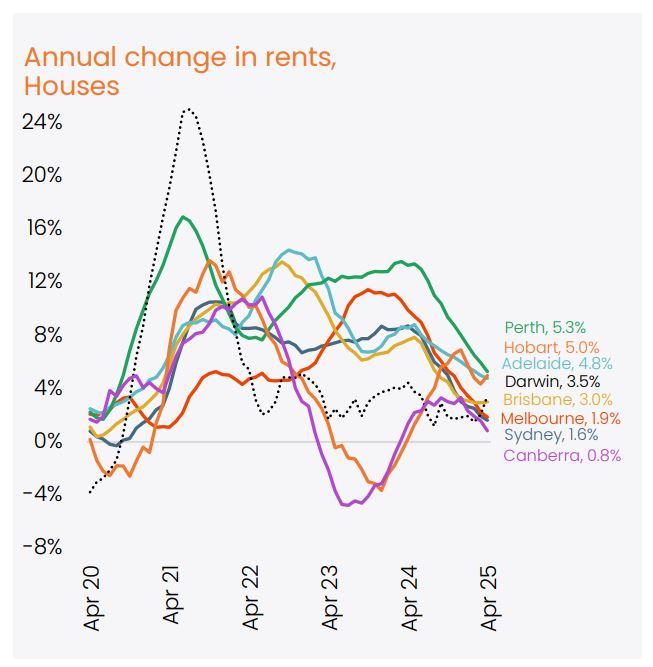
According to CoreLogic, rental growth has firmed, with the national rental index rising by 0.6% consistently over the past three months.
Adjusting for seasonality, the pace of growth is milder, with rents rising 0.4% nationally in April.
Despite the strong seasonal performance through the start of the year, a slowdown in rental growth is more evident in the annual change, where the pace of growth has more than halved, from 8.3% over the 12 months to April 2024 to 3.6% over the most recent 12-month period.
Most capitals have recorded a material reduction in the pace of annual rental appreciation.
Sydney
| Property Type | Rent ($) | Weekly change | Monthly change | 12 Months change |
|---|---|---|---|---|
| All Houses | $1,065.68 | 2.32 | 0.6% | 0.4% |
| All Units | $707.89 | -3.89 | -0.6% | -0.2% |
| Combined | $852.99 | -1.37 | 0.0% | 0.1% |
Source: SQM Research
Melbourne
| Property Type | Rent ($) | Weekly change | Monthly change | 12 Months change |
|---|---|---|---|---|
| All Houses | $764.46 | 2.54 | 0.9% | 2.7% |
| All Units | $566.31 | -0.31 | -0.6% | 1.7% |
| Combined | $648.65 | 0.88 | 0.1% | 2.3% |
Source: SQM Research
Brisbane
| Property Type | Rent ($) | Weekly change | Monthly change | 12 Months change |
|---|---|---|---|---|
| All Houses | $758.33 | 1.67 | 0.1% | 5.7% |
| All Units | $595.31 | -0.31 | -0.3% | 2.8% |
| Combined | $684.93 | 0.78 | 0.0% | 4.5% |
Source: SQM Research
Perth
| Property Type | Rent ($) | Weekly change | Monthly change | 12 Months change |
|---|---|---|---|---|
| All Houses | $830.83 | -1.83 | 0.0% | 5.1% |
| All Units | $649.04 | -1.04 | 0.7% | 6.9% |
| Combined | $755.41 | -1.50 | 0.2% | 5.8% |
Source: SQM Research
Adelaide
| Property Type | Rent $) | Weekly change | Monthly change | 12 Months change |
|---|---|---|---|---|
| All Houses | $664.33 | -2.33 | -0.6% | 3.6% |
| All Units | $513.32 | -2.32 | -2.1% | 7.1% |
| Combined | $613.00 | -2.33 | -1.0% | 4.7% |
Source: SQM Research
Canberra
| Property Type | Rent ($) | Weekly change | Monthly change | 12 Months change |
|---|---|---|---|---|
| All Houses | $817.99 | 5.01 | 1.0% | 7.1% |
| All Units | $588.32 | 1.68 | 1.1% | 3.8% |
| Combined | $692.61 | 3.19 | 1.0% | 5.4% |
Source: SQM Research
Darwin
| Property Type | Rent ($) | Weekly change | Monthly change | 12 Months change |
|---|---|---|---|---|
| All Houses | $749.41 | 7.59 | 2.0% | 8.6% |
| All Units | $525.57 | -8.57 | -3.6% | -4.5% |
| Combined | $616.76 | -1.99 | -0.9% | 1.6% |
Source: SQM Research
Hobart
| Property Type | Rent 9$) | Weekly change | Monthly change | 12 Months change |
|---|---|---|---|---|
| All Houses | $555.61 | 6.39 | -1.8% | 5.0% |
| All Units | $478.51 | -14.51 | -2.4% | 3.2% |
| Combined | $524.77 | -1.97 | -2.0% | 4.3% |
Source: SQM Research
National
| Property Type | Rent ($) | Weekly change | Monthly change | 12 Months change |
|---|---|---|---|---|
| All Houses | $721.00 | -2.00 | -1.1% | 3.4% |
| All Units | $567.00 | 0.00 | 0.00% | 4.6% |
| Combined | $649.55 | -1.07 | -0.7% | 3.9% |
Source: SQM Research
Cap City Average
| Property Type | Rent ($) | Weekly change | Monthly change | 12 Months change |
|---|---|---|---|---|
| All Houses | $862.00 | 3.00 | 0.7% | 2.7% |
| All Units | $635.00 | -4.00 | -0.9% | 1.1% |
| Combined | $741.23 | -0.72 | 0.0% | 2.0% |
Source: SQM Research
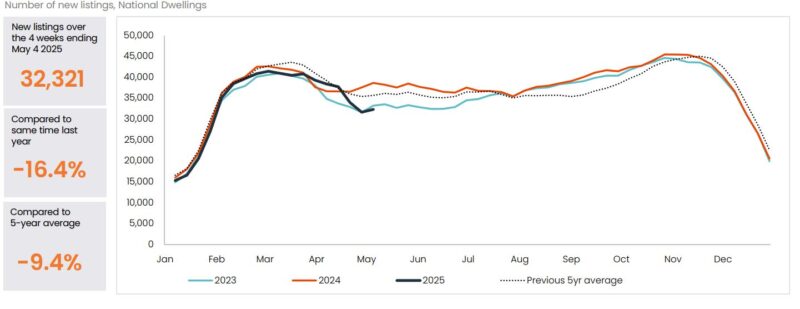
Sellers of good properties are on strike
The flow of new listings has been mostly tracking below the previous five-year average since late last year, a trend that became more evident through April due to seasonal factors including the Easter and ANZAC day long weekends.
A dent to consumer sentiment could be another factor influencing the softer trend in new listings through the month.
As the market moves into winter, the flow of new listings is likely to remain low relative to March levels.
The number of listings reduced further through April to be more than 12% below five-year average levels but roughly in line with a year ago (-0.5%).
The shortage of listings is more evident across regional Australia, where stock levels are 16.7% below average, while listings across the combined capitals are 9.4% below the previous five-year average.
Source: CoreLogic May 2025
Vendor metrics
As the following chart shows, it's taking longer to sell a home.
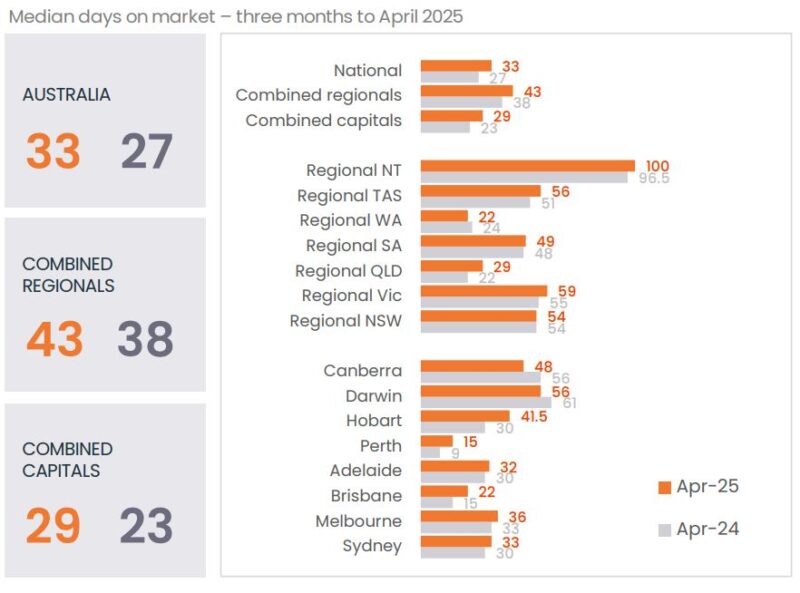
Despite the slowdown in sales activity, selling times are once again falling, with the national median time on market
dropping from a recent high of 36 days over the three months to February to 33 days over the three months to April.
Across the capitals, Darwin, Melbourne, Sydney and Canberra recorded the steepest declines compared to the three
months to February, down -13, -11, -10 and -8 days, respectively